

A response that stops halfway through leaves you with incomplete work and an unclear next step. A stream idle timeout means part of the request path waited too long without the activity needed to keep the stream open.
We recommend identifying which layer ended the stream before changing settings or retrying a large task. Start with the error message, then check the client, proxy, and load balancer in order.
What a Stream Idle Timeout Means
The error payload may include statusCode: 500, type: stream_idle_timeout, and needsRetry: true. Those fields describe the reported failure; they don’t identify the component responsible.
The message “The model stopped responding. Please try again.” also doesn’t establish that the model crashed. A client or intermediary may have closed the connection while the service was still processing.
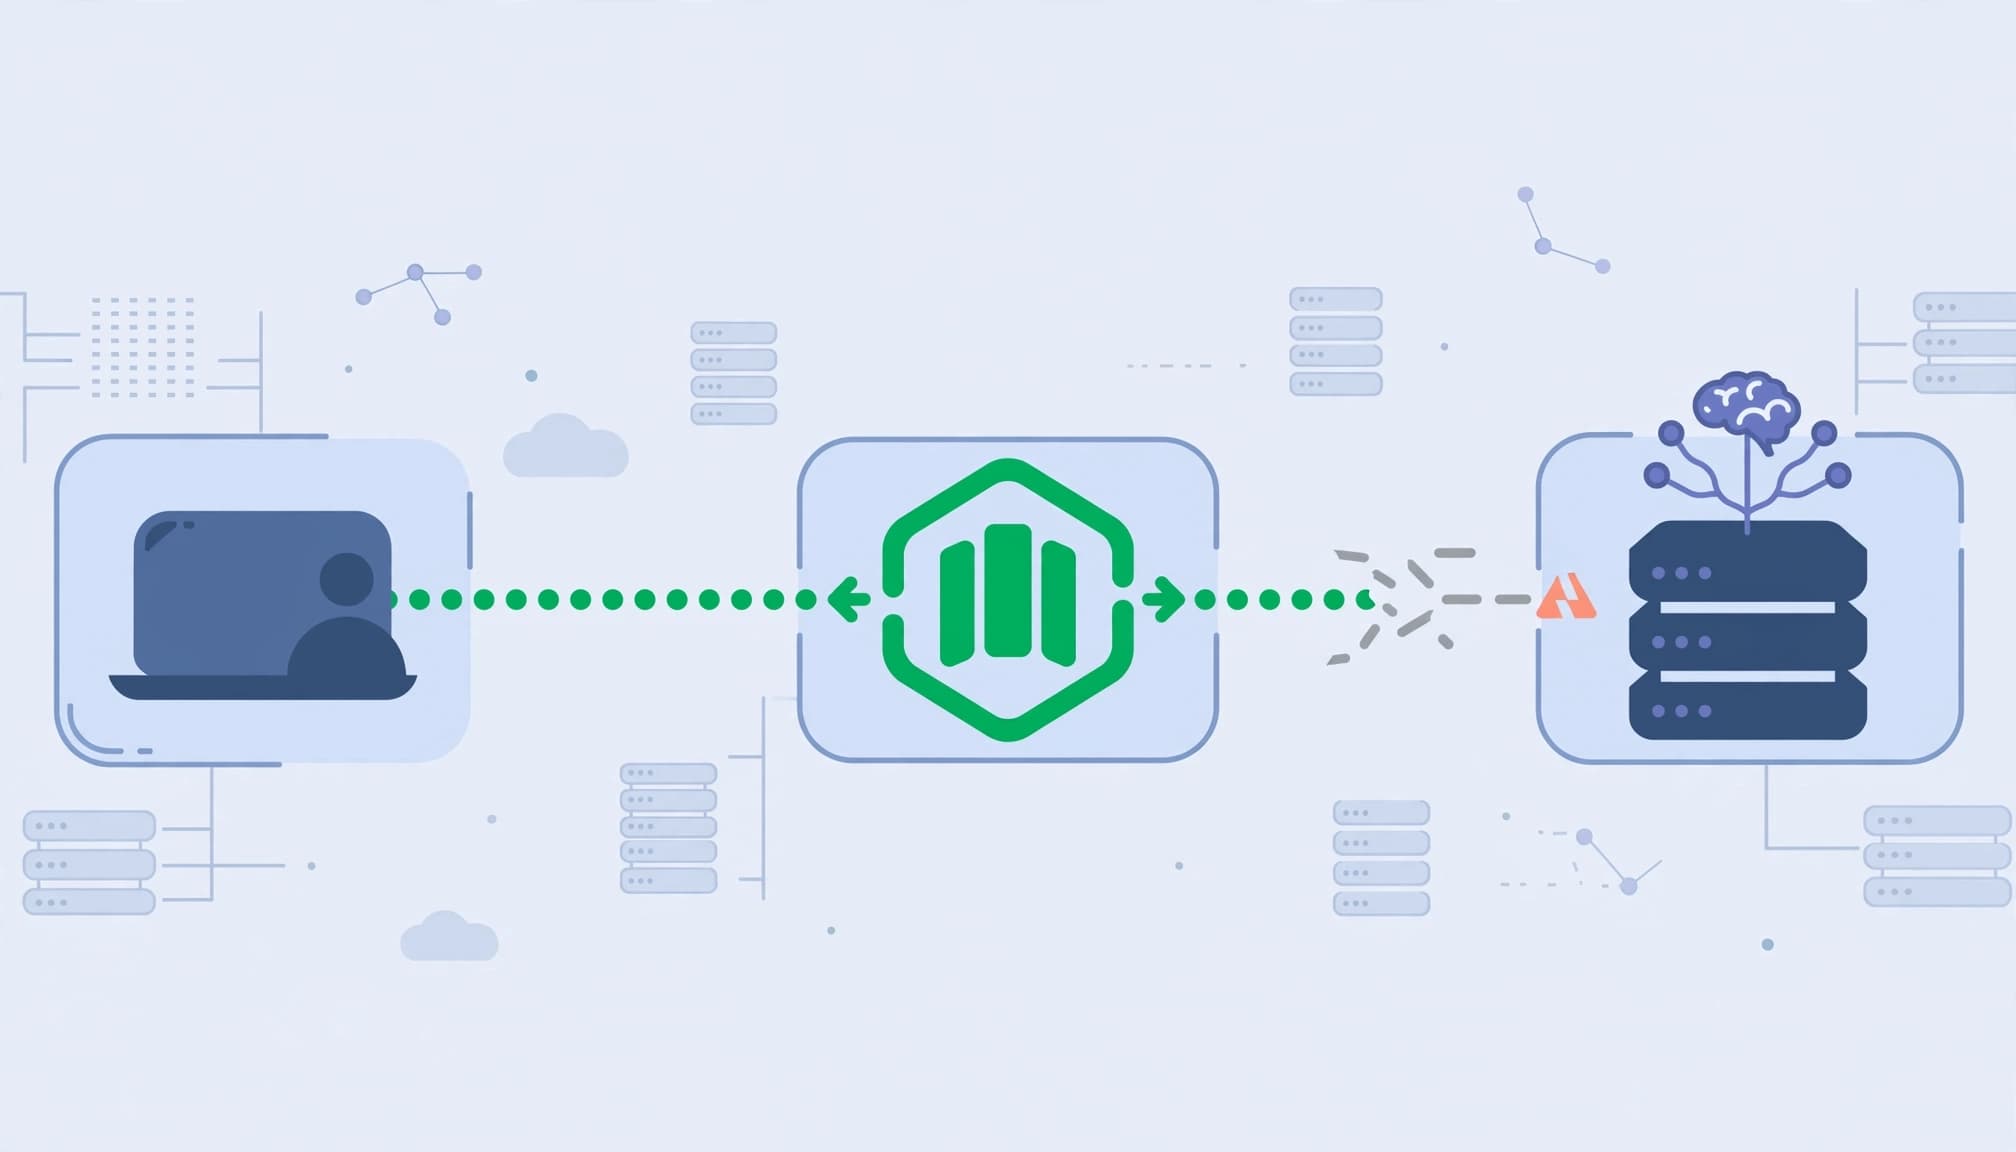
Connection Idle Timeouts Versus Stream Idle Timeouts
An HTTP connection idle timeout concerns a connection without active requests or streams. A stream idle timeout concerns inactivity within an individual request-response stream.
That distinction matters with HTTP/2, where several streams can share one connection. Traffic on another stream doesn’t necessarily keep the affected stream alive.
We separate these settings during diagnosis. Increasing a connection timeout won’t resolve a stream-level limit that remains unchanged.
Idle Timeouts Versus Request Timeouts
An idle timeout measures a period without qualifying activity. A request timeout limits a request according to that component’s timing rules.
A response can continue sending data yet exceed a total request limit. Conversely, a request can remain within its overall deadline but fail during a long pause.
Record both elapsed request time and the gap since the last response event. They help distinguish a total-duration limit from an inactivity limit.
Recover a Partial Response in Claude Code
When Claude Code reports a partial response, protect completed work before submitting the task again. An interrupted response doesn’t mean every file edit or tool action was rolled back.
Check the working tree, review the diff, and run relevant tests. We recommend continuing from the last confirmed result rather than repeating the entire operation.
Reduce the Work in Each Request
Large prompts and broad code changes can create longer processing periods. Break the task into bounded stages: inspect the relevant files, propose a change, implement it, and validate it.
Keep each request focused on the files and decisions it needs. Avoid attaching an entire repository when a smaller set provides enough context.
If your workflow supports both Opus and Sonnet, switching models can help compare behavior. It isn’t a guaranteed timeout fix. Record whether the interruption changes with the model, task size, or response length.
Verify Client Settings Before Changing Them
You may encounter references to CLAUDE_STREAM_IDLE_TIMEOUT_MS. Don’t assume your installed Claude Code release supports it.
Check documentation for that release before setting the variable. An unsupported environment variable can remain in your shell without changing application behavior.
Even a supported client-side setting can’t override a shorter timeout in a proxy or load balancer. We treat client configuration as one part of the request path, not a complete solution.
Before retrying, confirm whether the task changed files or started an external operation. Repeat only the work that remains incomplete.
Identify Which Layer Closed the Stream
A dependable fix starts with a reproducible failure. Capture the request start time, last received event, failure time, and any request identifier available.
We recommend this investigation order:
- Check client logs for the reported timeout and whether any partial output arrived.
- Review application logs to determine whether processing continued after the client disconnected.
- Inspect proxy and gateway logs for timeout flags, resets, or upstream failures.
- Compare those timestamps with the external load balancer’s connection records.
A repeated interruption near the same elapsed interval is a useful clue. It still needs confirmation against the configuration controlling that connection.
Where permitted, compare the same request through the normal ingress path and through a controlled path that bypasses one intermediary. Keep authentication, request content, and application version consistent.
Don’t disable security controls or expose a private service to perform this test. Use an approved internal diagnostic route.
Read the Last Successful Event
The last response event helps narrow the investigation. A stream that never sends its first event needs a different review than one that stops after substantial output.
Inspect buffering as well. The application may emit data that an intermediary holds instead of forwarding immediately. Compare application emission timestamps with client receipt timestamps.
Check Envoy Timeout Settings Separately
Envoy proxy has several timeout controls. Their scope matters as much as their duration.
Don’t copy a default value from another deployment. Envoy version, generated configuration, route overrides, and mesh settings can change the value that applies.
These settings address different conditions:
| Timeout Setting | What to Check |
|---|---|
| HTTP connection idle timeout | Whether the connection has active requests or streams. |
| Stream idle timeout | Whether an individual HTTP stream has qualifying activity. |
| Route idle timeout | Whether a route overrides the stream inactivity policy. |
| Request timeout | Whether the request exceeds its permitted duration. |
| TCP idle timeout | Whether the TCP proxy connection has qualifying traffic. |
The correct adjustment depends on the component terminating the request. Changing every timeout at once makes the result harder to verify.
Inspect the Effective HTTP Configuration
For HTTP traffic, review the HTTP connection manager and the selected route. Check both the general stream policy and any route-level override.
For WebSocket connections, confirm which listener, upgrade handling, and route carry the connection. For gRPC, examine the HTTP/2 route and relevant client deadlines.
We recommend checking the configuration loaded into the proxy. A manifest shows intended configuration; the running proxy shows what is active.
Keep TCP Configuration Separate
A TCP proxy idle timeout belongs to a different configuration path. Don’t assume an HTTP setting changes raw TCP behavior.
Likewise, transport keepalives aren’t a substitute for understanding the applicable HTTP stream timeout. Verify what activity resets the timer.
Configure Istio Without Changing Unrelated Traffic
Istio can generate Envoy configuration through several resources. Choose the resource that controls the setting you need.
A VirtualService manages routing behavior and supported route policies. A DestinationRule manages destination traffic policies, including supported connection-pool settings. An EnvoyFilter can modify generated Envoy configuration when higher-level resources don’t expose the required control.
Scope Changes to the Affected Workload
We recommend the narrowest supported configuration change. Identify the workload, listener, traffic direction, and route before applying it.
For WebSocket or gRPC traffic, avoid a mesh-wide timeout increase when only one service needs longer inactivity tolerance.
An EnvoyFilter requires care because it operates against generated configuration. Check the Istio and Envoy versions, match criteria, patch target, and applicable schema.
Use documentation for the installed release. A patch accepted by Kubernetes may still fail to modify the intended proxy configuration.
Verify What the Pod Received
Run istioctl proxy-config listeners with the affected pod name, namespace, and -o json. Inspect the relevant listener and HTTP connection manager.
Use istioctl proxy-config routes to inspect route configuration. Use istioctl proxy-config clusters when investigating upstream cluster settings.
Compare the effective configuration before and after the change. Also check proxy synchronization and configuration rejection messages.
This confirms whether the intended setting reached the pod. It doesn’t replace a live streaming test.
Coordinate Load Balancer and Application Timeouts
A longer client timeout won’t help when an earlier component closes the connection. Review the complete path, including an AWS Application Load Balancer if one is present.
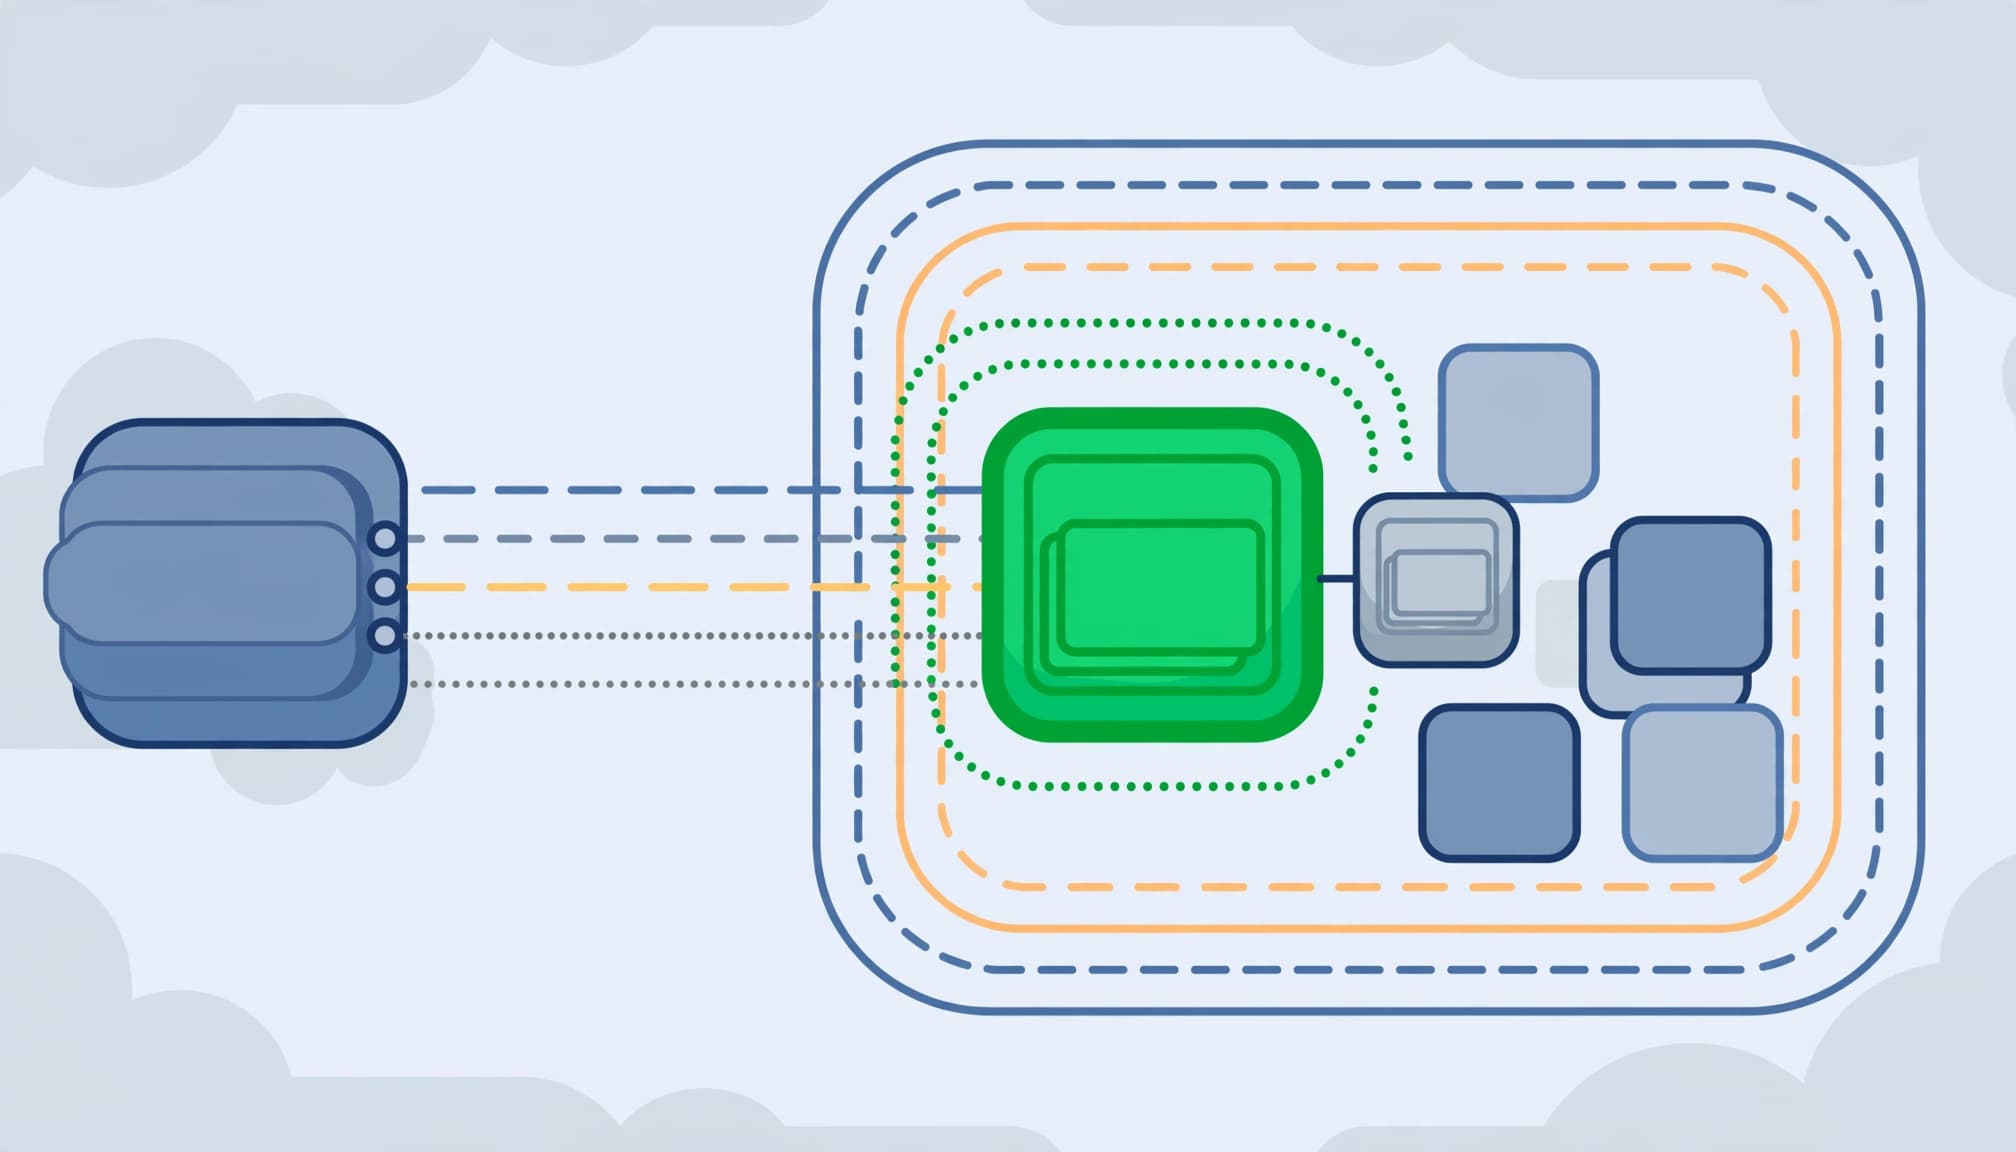
Record each applicable timeout, its scope, and the activity that resets it. Compare equivalent timers rather than assuming all settings called “idle timeout” behave identically.
Increasing a downstream timeout can’t override an upstream component that has already closed the connection.
For long-lived gRPC or WebSocket sessions, consider supported application-level heartbeats. They must produce activity recognized by the component enforcing the timeout.
Don’t insert arbitrary content into an AI response stream. Heartbeats must follow the protocol and remain compatible with the client.
We recommend bounded timeouts that accommodate expected pauses. Indefinite connections need separate controls for resource use, cancellation, and abandoned sessions.
Validate the Fix Under Real Streaming Conditions
A successful short request isn’t enough. Test the behavior that originally failed, including its longest expected quiet period.
Compare the same workload before and after the change. Keep the model, request content, connection path, and client version stable wherever practical.
For HTTP streaming diagnostics, curl -N disables curl’s output buffering. Verbose output with -v can provide additional connection details. Protect credentials and sensitive response content when collecting logs.
In Envoy access logs, review response flags and response-code details alongside request duration. Check application logs for continued processing after disconnects.
Prometheus monitoring can help track timeout counters, connection closures, and request duration. Metric names depend on the deployment and export configuration; inspect the available series before building an alert.
We also recommend testing cancellation, client disconnects, and service restarts. A longer timeout shouldn’t leave abandoned work running without limits.
Record the final effective settings and the test result. That record makes later configuration changes easier to evaluate.
Frequently Asked Questions
Why Do Long-Lived gRPC Streams Get Terminated?
An open gRPC stream can encounter stream inactivity limits, application deadlines, network failures, or service restarts. The connection being open doesn’t guarantee uninterrupted delivery.
Check client deadlines and intermediary settings independently. A protocol keepalive isn’t proof that every HTTP inactivity timer has reset. Logs and effective configuration should identify the cause before you extend any limit.
Is Retrying Enough After a Partial Response?
Retrying may recover from a temporary interruption, but it won’t correct a repeatable timeout boundary.
For read-only requests, a bounded retry policy may be appropriate. For tasks that modify files or trigger external actions, confirm what completed first. We recommend resuming from verified progress rather than automatically replaying a potentially non-idempotent operation. A needsRetry: true field doesn’t guarantee that every action is safe to repeat.
Restore the Stream With a Targeted Fix
A stream idle timeout needs a verified cause, a scoped change, and a realistic validation test. Start with the last successful event and follow the request through each connection layer.
We recommend protecting partial work before retrying. Adjust only the confirmed timeout boundary, then document the result so the same interruption is easier to diagnose next time.